
Nifty Breaks 22,500 as US Bond Yield Hits 5.33%: What's Driving the Market Sell-Off?
Nifty breaks 22,500 for the first time in 124 sessions as FII selling, high US yields and weak global cues deepen pressure on Indian equities.
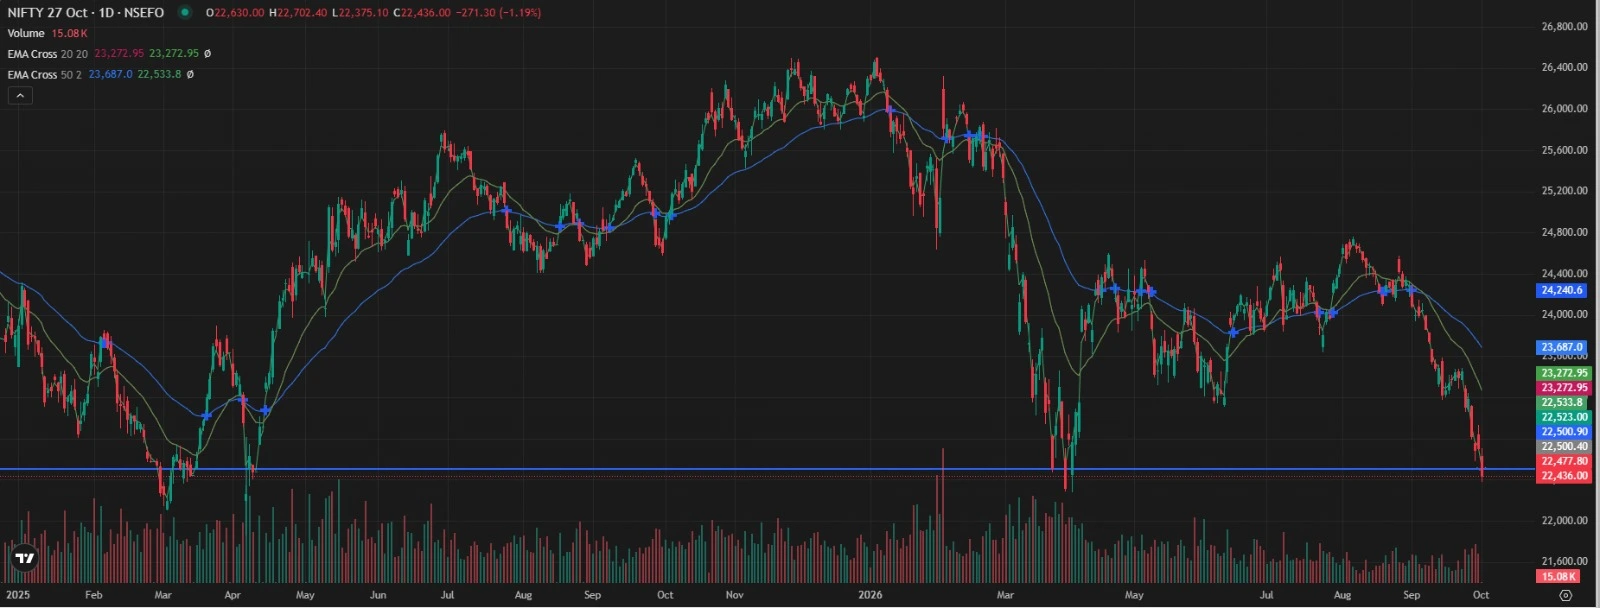
Nifty 50 falls below 22,500 amid global and domestic market pressure.
Summary: On October 1, 2026, Nifty broke the key support zone and 200 week moving average to Fall to 22,500 level. The break was in combination with f II selling, rising US treasury yields and a defensive in the derivative markets.
Key Takeaways
- Nifty broke below 22,500 for the first time since April 2, 2026, today.
- Nifty is breaking new lows due to heavy selling by FIIs and traders taking defensive positions on derivatives.
- The backdrop of global liquidity has taken a turn for the worse, as the 10-year US treasury yield has moved up to the 5.3% levels.
- In addition, Nifty is also trading below its 200 week moving average.
- The 22,500-22,600 levels were previously support and if Nifty cannot reclaim these levels, we can expect further downside.
Nifty breaks 22,500 on Oct 1, 2026, will be noted as an important event in the history of the Indian stock market. After touching 22,500 on April 2, 2026, due to minor corrections, Nifty again moved below 22,500 after four weeks, on account of continuous foreign selling, rising global bond yields and bearish derivative positions. Fall also accompanied a breakdown of 200 week moving average.
There are several developments which together create a hostile environment for Indian equity markets. These include rising US treasury yields, continued FII selling, elevated crude prices and rupee depreciation. First and foremost, traders and investors will look for quick retest of 22,500 on Nifty.
Nifty Breaks 22,500: What Happened Today?
Nifty broke down quickly from around 22,570 to 22,500, and then to 22,490 in today's trading session. According to the markets data, the index last traded below 22,500 on April 2, which is about 124 trading sessions back.
Beyond the psychological significance of a round number, the 22,550/22,500 level was a key near term support. Once the index broke below this level, it was expected that the market would be in the trade the level and extend losses.
Why Is Nifty Falling? Multiple Factors Are Working Together
1. Persistent FII selling
As per a recent post, Nifty Cash data over the last few sessions showed continuous selling by FII's, to the tune of 10,148 crores, against cumulative buying by domestic institutions of 11,271 crores. Continuous buying by domestic institutions has provided some floor to the market, but has failed to absorb selling by FIIs.
Lackluster attitude of FII's has also been evident from the other side of the market. Data published by Reuters and cited by Business Upturn showed that on the previous Wednesday, i.e., 6th Oct'20, FII’s sold Indian equities worth approximately $1,060 million. This made the 5-day cumulative selling to the tune of $3,578 million and net selling for the year to date, to $27,818 million. These figures however represent transitory nature of the market and hence should not be confused as definitive data.
2. US bond yields remain elevated
The US bond market is another major international market to watch. Recently, the 10-year US Treasury yield was around 5.3%, and Reuters quoted that as 5.306%. Increased US yields make it less attractive for investors to take risk in other markets.
Higher US yields increases the cost of capital globally. This makes equity valuations in other markets less attractive. Investors are then motivated to re-balance their portfolios to take less risk, and to reduce their exposure to emerging markets.
Although, current US yields are at higher levels, it doesn’t mean other market risks are not at play. The recent movements in the Nifty 50 are a result of the confluence of many risk factors.
3. Derivatives positioning is heavily defensive
Reported data showed that FIIs had long positions of about 9 % and short positions of about 91 %. Thus, the positioning was highly defensive.
When the support level of a security is broken and the major players in the market are already positioning themselves to the short side of the security, any of a host of minor negative events could lead to further selling. For example, stop losses could be triggered and options positions and other hedges could be adjusted. Finally, in extremely negative or extremely positive cases, the positioning of the players could result in a small net change in price producing a large absolute price move, e.g. the liquidation of a large short position.
4. Crude oil is a major macro factor
Crude oil has also troubled the Indian equity markets. Recently Brent crude was trading in the range of $105 to $106. It has since come down to the $96 to $98 range. Though the more recent levels provide some comfort, crude oil has traded at elevated levels and caused anxiety in the Indian markets.
Why the 22,500 Level Matters
According to the source, the 22,500 level is notable as it has functioned as a major support level. The source states that put options trading around the 22,500 and 22,700 levels indicated support from traders around those levels. Traders may have taken a bearish view of the market and traded options accordingly. Should the support at 22,500 level break, traders may take further protective or defensive actions, thereby increasing the level of volatility.
Furthermore, in the options market, it is generally observed that support levels break and become resistance levels. Therefore, should the level of 22,500 break support and bearish sentiment prevail, a further decline in the market is possible. A rise above the 22,500 level may indicate a bear trap. Weekly options are generally more telling than daily options for determining longer-term trends. Therefore, a weekly close above 22,500 is more relevant than daily closes for this analysis.
Nifty Falls Below the 200-Week Moving Average
Another important technological change occurred with Nifty dropping below its 200-week moving average. Weekly moving averages represent prices over a four-year period and help analyze longer-term trends.
2008 and 2020 are the only recent, notable, sustained periods where the global market broke down and moved below longer-term averages. In addition, the Nifty 50 briefly moved below the 200-week moving average in January 2012, but reclaimed that level in the subsequent few sessions. Therefore, stating that the last two occasions that Nifty moved below its 200-week moving average was only in 2008 and 2020, is not accurate.
The point is that a breakdown of a moving average does not indicate the absolute bottom of a market cycle. From 2008 to 2009, Nifty stayed below the 200-week moving average for approximately 32 weeks, and during the 2020 market rout, Nifty stayed below the average for a total of six weeks. Given the major policy and market liquidity changes that occurred from 2008 to 2020, the average and bound reversion should not be used to explicitly predict the length and timing of market cycle lows.
Is This Capitulation or a Deeper Breakdown?
The answer cannot be established from one trading session. A capitulation phase generally involves exceptionally intense selling followed by signs that sellers are becoming exhausted and buyers are absorbing supply. A deeper breakdown, by contrast, would involve continued weakness, failed recovery attempts and further deterioration in market structure.
For the current setup, several indicators deserve attention:
22,500–22,600: whether Nifty can reclaim the broken support zone.
200-week moving average: whether the index can recover and sustain above this long-term trend indicator.
FII flows: whether foreign selling begins to moderate.
US Treasury yields: whether global bond-market pressure eases.
Crude oil: whether prices remain below recent elevated levels.
Derivatives positioning: whether extreme short positioning begins to unwind.
Nifty's Long Losing Streak Adds to the Concern
October 1's decline occurred after Nifty closed lower for seven weeks in a row. If it ended the week lower, it would have fallen for eight weeks in a row, a bear trend that would be unprecedented over the past few years. Market watchers cited Reuters for the comparison with previous instances of market volatility.
As for this year, September was particularly bad as Nifty fell by about 6.1% and closed at 22,620. During the month, Net-Net, Foreign Portfolio Investors (FPIs) sold a record high of about $2.7 billion worth of Indian stocks. September options series are said to have dropped by 6.7%.
What Could Investors Watch Next?
The immediate technical question is whether Nifty can reclaim 22,500. A recovery above that level, followed by sustained trade through the 22,600–22,700 area, could indicate that the breakdown is losing some of its force. On the other hand, continued trading below the zone would keep the bearish technical structure intact.
Lower technical reference zones cited in market commentary include approximately 22,350–22,400, followed by the April low around 22,200. These are technical reference points, not forecasts or guaranteed downside targets.
Investors tracking the broader market can also monitor fundamental analysis of stocks rather than relying only on index-level price movements. During a broad correction, individual companies can behave differently depending on earnings, valuation, balance-sheet strength, sector exposure and company-specific developments.
What Does the Sell-Off Mean for Indian Investors?
In the short term, equity markets are volatile and uncertain. However, it’s important for an investor to differentiate between risk factors that impact the market as a whole and the risk factors that impact a particular equity. Currently, the negative outlook on the equity index is on account of several factors including international liquidity, international fund flows, interest rates and crude oil prices.
When an investor reviews his/her equity portfolio, it is more useful to differentiate between what has impacted the equity’s business outlook, what has impacted the equity’s valuation and what has impacted the equity’s market price. Rising or falling equity prices do not always indicate improvement or deterioration in the underlying business.
For the fixed-income side of the portfolio, the Indian bonds investment page can provide context on bonds and interest-rate sensitivity. Readers can also explore what are bonds in India before comparing equity and fixed-income market dynamics.
Conclusion
Nifty broke down support below 22,500 on October 1. This breakdown was prolonged and also saw a closing price below the 200 week moving average, which was also affected by heavy foreign selling and defensive derivatives. The elevated 10 Year US Treasury note yield creates additional risk on the downside.
The most important conclusion is that a new bear market has started or that a bottom has been put in. The focus should be on the next few minutes, hours, and days. The weekly close will be most important. Many believe that the 22,500 level has been broken and should be watched closely by all investors. A number of analysts also believe that the recent market moves have been caused mostly by technical reasons and should not be primarily attributed to changes in the economy.
Frequently Asked Questions
Why did Nifty break 22,500?+
Nifty's break below 22,500 was associated with persistent FII selling, elevated US Treasury yields, defensive derivatives positioning and broader global risk-off conditions. Crude oil and currency pressure have also been important macro variables.
What does Nifty breaking below 22,500 mean?+
It means an important technical support zone has been breached. The next question is whether Nifty can reclaim 22,500–22,600 or whether the former support becomes resistance.
What is the 200-week moving average?+
The 200-week moving average is a long-term technical indicator based on weekly prices over approximately four years and is commonly used to assess the broader market trend.
Does a break below the 200-week moving average mean the market will crash?+
No. The indicator does not predict the exact size or duration of a correction and cannot identify a market bottom by itself.
Are US bond yields affecting Indian stocks?+
Higher US Treasury yields can affect emerging-market valuations, global funding costs and foreign capital allocation, although they are only one of several factors influencing Indian equities.
What levels should investors watch after Nifty breaks 22,500?+
The immediate focus is on 22,500–22,600. Lower technical reference zones cited in recent commentary include approximately 22,350–22,400 and the April low near 22,200.
Disclaimer
This article is for investor education only and does not constitute investment advice, a recommendation, or an offer to buy or sell any security.
Markets involve risk, including possible loss of capital. Please do your own due diligence or consult a registered adviser.
Research views are informational and may change without notice. Past performance is not indicative of future results.
Data on the markets including indices, Flows, Treasury yields, levels and other technical information, are time-bound and may not be reliable if published or updated without verification against the latest quotations.
Research Team
InvestEdge360 Research
Content Research Desk
Insights from InvestEdge360's research desk — written to help investors learn with clarity and invest with discipline.
Track the Latest Market Developments
Stay informed about major Indian market moves, macroeconomic developments and stock-market news before making investment decisions.
Open Demat AccountRelated Articles
- Market News
IT and Banking Stocks Bounce Back: Fresh Buying in Key Stocks
- Market News
Market in Bear Grip: Why Some Stocks Are Outperforming Despite the Market Weakness
- Market News
Why Gold and Silver Falling Today: MCX & Global Reasons
- Market News
Whirlpool of India Shares Hit 20% Upper Circuit: Stake Sale Explained

Was this article helpful?
🚀 Open your Demat & Trading account
- Free Account opening charges
- Free DP transaction charges ⭐
- Free premium research & market updates