
Gold and Silver Crash 2026: What HH, HL, LH & LL Reveal
Why are gold and silver falling? Understand lower highs, lower lows, Fed and dollar drivers, and a practical checklist for gold and silver ETF investors.
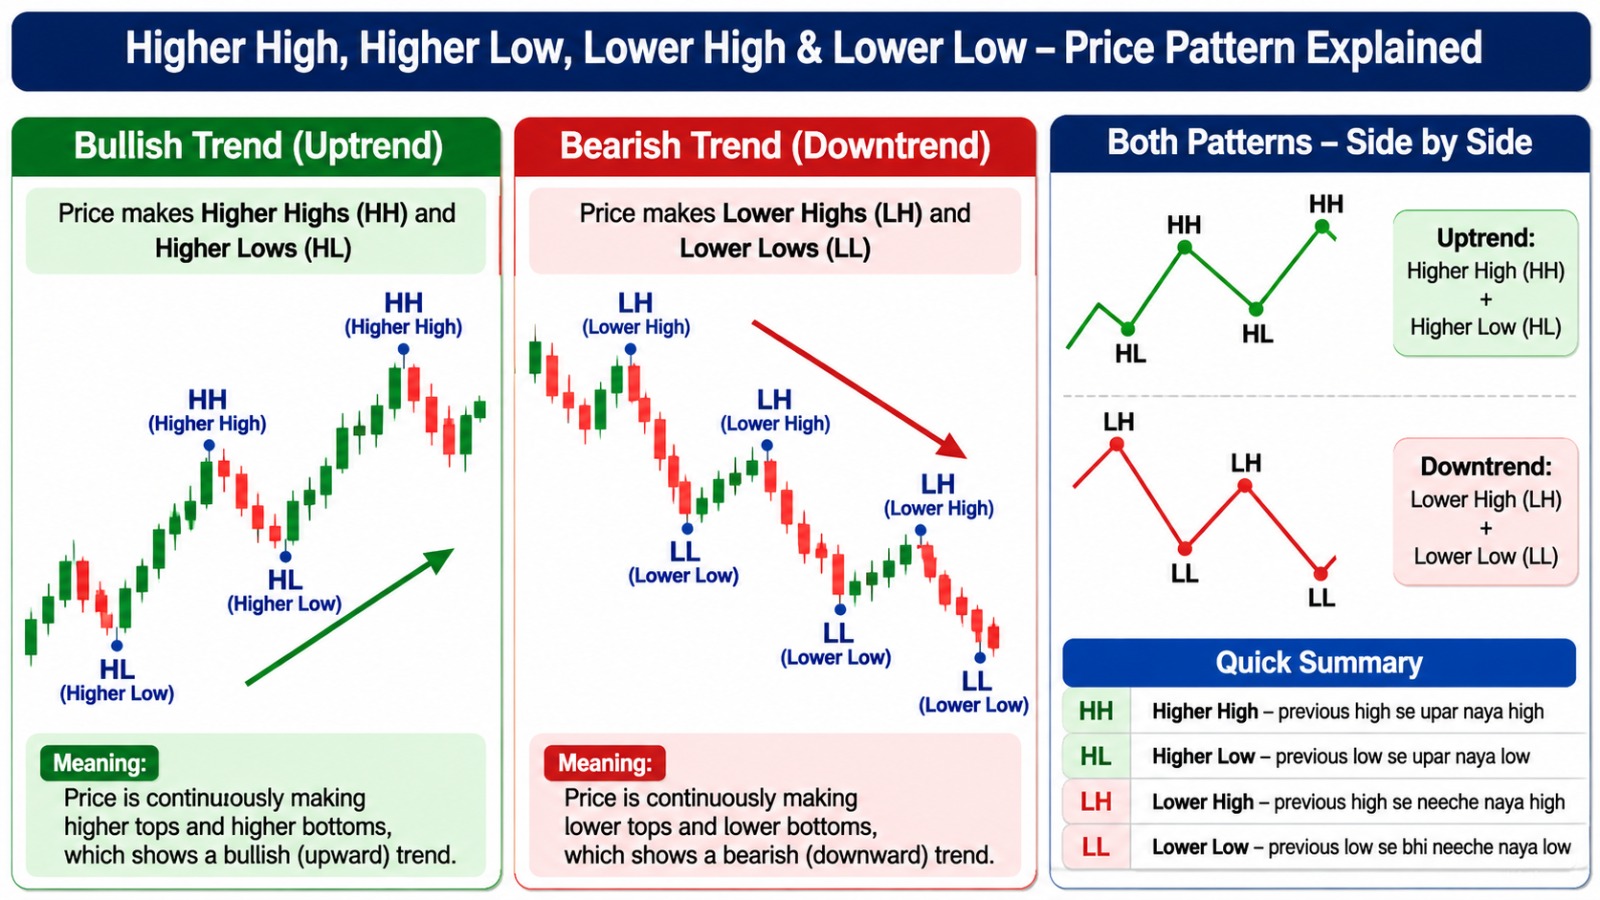
How to read HH, HL, LH and LL in a price trend. Illustration only; not live gold or silver market data.
Summary: This November 2026 market-education article will explain the gold and silver sell-off, the concept of higher highs, higher lows, lower highs and lower lows, how metals can drop with equities, and how Indian ETF investors can understand risks associated with their investments without making a price forecast.
Key Takeaways
- On November 20, 2026, Reuters reported steep losses in international gold and silver. Reuters also quoted MCX futures figures from the early trade, and not end-of-day figures.
- Higher highs (HH) and higher lows (HL) typically describe an uptrend on a given timeframe. Lower highs (LH) and lower lows (LL) typically illustrate a downtrend on the same timeframe.
- The reference chart is for educational purpose only, and does not prove that the instruments in question have formed confirmed swing patterns.
- During a stock-market sell-off, gold and silver can also drop, because investors are raising cash. Lower rates and a weaker USD can relieve some of the pressure on gold and silver.
- A possible bottom can not only be signaled by an oversold condition; a rebound from a significant low would require confirmation.
- Gold and silver ETFs are subject to the price risk of gold and silver, tracking risks, currency risks and liquidity risks. MCX leveraged futures can lead to margin calls and unlimited losses.
🚀 Open your Demat & Trading account
- Free Account opening charges
- Free DP transaction charges ⭐
- Free premium research & market updates
Last updated: 21 November 2026. The gold and silver crash 2026 has put a familiar question in the forefront: how do investors identify a pullback that is turning into a trend? The structure of a market, which is the formation that consists of higher highs and higher lows that make up an uptrend, can help give an answer to this question. Investors looking at gold and silver ETF investment options can use this formation to structure better questions prior to making an investment. This framework should not be used in an attempt to forecast or time a future price.
Gold and Silver Crash 2026: What Happened on 20 November?
Gold and silver suffered sharp selling on 20 November 2026. Reuters reported on 20 November that spot gold had dropped by about 3% to trade at US$3514.08 per troy ounce at 3:25 p.m. ET. This quote was reported to be an intraday low. Spot silver had also dropped about 4% to trade at US$40.99 per ounce, according to Reuters' report. Reuters noted a 9.4% weekly fall in gold prices. These prices and quotes are from the international spot markets and do not represent Saturday prices or Indian retail jewellery prices.
In India, December gold futures were down approximately 3.94% to ₹1,22,430 per 10 grams, and December silver futures were down approximately 5.73% to ₹1,48,466 per kilogram, in the early MCX trade. Again, these are time specific prices from the futures market, and not closing prices. Spot prices in the international market, MCX futures prices, ETFs prices, and Indian retail prices are different things and can not and should not be compared to each other.
Market and instrument | Reported 20 November figure | What the number means |
|---|---|---|
International spot gold | About US$3,514.08/oz; down 3% | Reuters late-Friday US-session quote |
International spot silver | About US$40.99/oz; down 4.1% | Reuters late-Friday US-session quote |
MCX December gold futures | About ₹1,22,430/10 g; down 3.94% | Reported early Indian trade, not the close |
MCX silver futures | About ₹1,48,466/kg; down 5.73% | Reported early Indian trade, not the close |
The figures above come from the 20 November Reuters bullion report and dated Indian MCX coverage. Because 21 November is a Saturday, these should be read as observations from Friday's trading, not as continuously updating quotes.
What Do HH, HL, LH and LL Mean on a Price Chart?
Your reference infographic shows two illustrative price structures. It does not contain a verified time series for November gold or silver. A swing high is a local peak relative to nearby price movements; a swing low is a local trough. The same letters can be identified on a five-minute chart, a daily chart or a weekly chart, but their significance changes with the timeframe and the method used to identify a swing.
Pattern | Plain-English meaning | Possible interpretation |
|---|---|---|
HH — Higher High | A meaningful swing peak rises above the previous peak. | Buyers have pushed prices to a new local high. |
HL — Higher Low | The next meaningful trough stays above the previous trough. | Buyers are defending a higher price area. |
LH — Lower High | A rebound peaks below the previous significant peak. | Buying rallies has become less effective. |
LL — Lower Low | The next trough breaks beneath the preceding trough. | Sellers have pushed the market to a new local low. |
HH plus HL is a typical uptrend sequence. LH plus LL is a typical downtrend sequence. Mixed highs and lows can mean a sideways range or a transition rather than a clear trend. None of these labels is a standalone instruction to buy or sell.
Why Can Gold and Silver Fall When Stock Markets Are Also Down?
Many investors refer to gold as a defensive or safe-haven asset, but that doesn’t always mean gold’s price appreciation occurs during every stock market sell off. During broad market declines, many types of investors and traders, including leveraged ones, may be forced to sell some or all of their positions. These investors and traders may be required to sell some or all of their gold holdings to meet margin calls or to fulfill other types of capital calls. The drop in the price of gold in November occurred during the broad market sell-off in AI-related equities. Reuters attributed the price of gold drop to forced selling.
A strong US Dollar means that dollar-priced metals can be more expensive for non-US buyers. Additionally, a rise in nominal or real interest rates can also increase the opportunity cost of holding bullion, thereby decreasing its price. Silver, like gold, can also have an inverse correlation to changes in risk appetite and the outlook for manufacturing and the global economy.
For Indian investors, changes in the rupee-dollar exchange rate can also affect international prices of metals, but local customs duties and fund expenses can also play a role. A change in the global spot price of gold does not guarantee the same movement for gold ETFs traded in India.
How to Recognise a Downtrend in Gold or Silver
A large red candle indicates selling at that candle. Identifying a sequence of HH/HL/LH/LL, (a representative swing point being H, and a mean swing point being L) constitutes a downtrend. The following is a method of interpreting a chart; it is not evidence for completing a particular pattern for gold or silver.
Choose the instrument and timeframe. For this example we are looking at medium term or longer term investment instruments and will use daily or weekly timeframes for spot gold, spot silver, and ETFs.
Mark completed swing highs and lows. Do not relabel intraday highs and lows. Slight variations can occur between analysts.
Compare each rally with the previous rally. A bounce that stalls below an earlier significant high can create a lower high (LH).
Check the following decline. A move below the last significant trough can create a lower low (LL) and intensify the down-trend.
Look for failed breaks and time-frame conflict. An intraday down-trend can be up-trending weekly. A daily downtrend can be up-trending weekly.
Illustrative example: Suppose a market peaked at 118 units, fell to 103, bounced to 112, and then dropped again to 97. In this example, the second high at 112 is a lower high (LH), and the trough at 97 is a lower low (LL). Note that these prices are completely made-up, and are not reflective of actual gold and silver prices. A separate downloadable editorial chart is available for the CMS Image Editor.
Does a Lower Low Mean Gold and Silver Will Keep Crashing?
No. A lower low shows what price has already done, not what it must do next. Sharp sell-offs can end in a rebound, enter a trading range or continue downward. An oversold indicator, a news-driven spike or a single green candle does not prove a durable bottom. Markets may also record a temporary break beneath support before recovering, sometimes described as a false breakdown.
What develops after the sell-off? | What the structure may suggest | What to avoid assuming |
|---|---|---|
New LH followed by another LL | Downtrend remains intact on the selected timeframe. | That the next decline will be of a fixed size. |
Price holds a similar low and moves sideways | Possible consolidation; direction unresolved. | That sideways movement confirms the bottom. |
Higher low, then a move above a prior lower high | Possible early evidence of structural change. | That one breakout eliminates all downside risk. |
Brief break above resistance followed by a fall | A failed breakout or rally within the decline. | That the first bounce was a confirmed reversal. |
Analysts can use support and resistance zones, trading volume, volatility and the behaviour of the broader market as additional context. The CME Group's support-and-resistance education explains why these levels are better treated as possible areas of reaction than guaranteed barriers.
What Could Change the Gold and Silver Outlook Next?
There are different types of market data, and each answers different questions. Charts are a good source of information to discover the behaviour of market participants. However, to decipher the reason behind their decisions, fundamental data come in handy. As of 21 November, the next anticipated Federal Reserve policy meeting was set for 8 and 9 December 2026. Traders should review the actual decision and communication and compare them with the anticipated outcome to decipher if a rate hike is expected.
US dollar and Treasury yields: Persistent strength can put pressure on non-interest bearing metals, but the relationship can be temporary.
Federal Reserve policy expectations: Inflation data and other jobs data along with communication can influence expected future rates.
Equity-market liquidity: Further selling in equity markets can put pressure on typically defensive assets.
Silver industrial demand: Growth expectations for technology and other industries can impact silver demand.
INR and domestic premiums: Currency and local market conditions can make Indian price premiums differ from spot.
Actual chart structure: Watch for a selection to form lower lows and lower highs. Other times it may consolidate. Ideally, it should begin to make higher lows and higher highs.
Gold ETF, Silver ETF or MCX Futures: What Is Different During a Crash?
Choosing the right instrument is as important as taking the right market call. Investors looking for leveraged exposure need not look beyond Gold and Silver ETFs, which offer exchange traded units of the respective metals, subject to tracking difference, liquidity and premiums/discounts to net asset value (NAV). An ETF can still fall substantially from its underlying metal price. Silver ETFs can see relatively larger price swings than gold ETFs, due to the metal’s price behavior as well as the market conditions for the ETF.
A new investor can read our guide on how to buying gold ETFs or understand how silver ETFs work in India, and take a call on the costs and risks involved. Depending on the exchange and the account being held, the investor may need to obtain the right account access in order to purchase an ETF. When reviewing brokerage supported investing, a potential customer can look into Demat account to see the costs and the process involved, as not all brokerages use the same process.
MCX futures, on the other hand, carry counterparty risks and marginal exposures to losses which can exceed the initial outlay. There are daily mark-to-market requirements and they carry a different set of risks as compared to unleveraged ETFs. New investors should learn about the basic tenets of commodity trading and platform eligibility and determine the costs involved. Futures, like ETFs, do not provide capital protection.
Route | Typical exposure | Main checks in a volatile market |
|---|---|---|
Gold ETF | Gold-linked listed fund units | Expense ratio, tracking difference, NAV premium/discount and liquidity |
Silver ETF | Silver-linked listed fund units | Higher price swings, liquidity, spreads and tracking difference |
MCX metal futures | Contract exposure with margin | Leverage, expiry, mark-to-market, liquidity and potential margin calls |
Risk-First Checklist Before Responding to a Gold or Silver Crash
Instead of asking whether today's price is the lowest possible, investors can use a repeatable checklist. This does not produce a trade signal; it is intended to prevent avoidable decisions based on a headline or a single chart image.
Check the quote: Confirm date, time, currency, unit and whether it is spot, futures, jewellery or ETF pricing.
Check the timeframe: Separate a daily correction from a multi-week or multi-month trend.
Mark genuine swing points: Test whether a completed sequence of LH and LL exists in that instrument.
Define your time horizon: A long-term allocation question is different from a short-term derivative trade.
Review costs and liquidity: Compare ETF expense ratio, bid-ask spread, NAV and any account charges.
Review concentration: Calculate how much of your portfolio already depends on precious metals.
Plan for further falls: Avoid borrowing or concentrating funds merely because prices have dropped.
Wait for evidence when uncertain: A stable low, higher low and sustained recovery past a prior swing high offer more information than a one-day bounce, but no guarantee.
For additional background on the macroeconomic forces behind the selling, see our existing article on why gold and silver prices fall. This guide's distinctive focus is the HH/HL/LH/LL framework and how to apply it carefully when reading real charts.
The Bigger Lesson: A Downtrend Is a Description, Not a Forecast
November 2026 was a harsh reminder that precious metals can greatly impact interest rate outlooks and dollar moves. Weakening price structures can be described by a series of lower highs and lower lows; however, it doesn't indicate where an asset can find a bottom. Alternatively, a possible higher low can be considered a bullish sign and can possibly suggest a bottom, but it does not necessarily confirm a longer-term bottom.
A robust understanding of market structures, risk limits and a clear understanding of ETFs and futures can help improve the analysis of when to buy and sell. Don't make a portfolio decision based on a single infographic. Use the price history of the actual asset and review the product literature to support your analysis.
Frequently Asked Questions
What do HH, HL, LH and LL mean in gold and silver charts?+
HH means higher high, HL higher low, LH lower high and LL lower low. Analysts compare successive meaningful swing peaks and troughs on a consistent timeframe; HH/HL generally describes an uptrend and LH/LL generally describes a downtrend.
Did gold and silver crash on 20 November 2026?+
Yes, bullion sold off sharply. Reuters reported spot gold near US$3,514.08 per ounce, down 3%, and spot silver near US$40.99, down 4.1%, in its late-Friday 20 November update. These are dated international spot observations, not live Saturday quotes.
Does a lower low prove that gold or silver will continue falling?+
No. A lower low records an earlier price break but does not forecast the next move. The instrument might keep falling, stabilise or rebound. Timeframe, swing selection and additional evidence matter.
Why do gold and silver sometimes fall alongside stock markets?+
Broad market stress can create cash needs or margin calls, prompting selling in liquid assets. A stronger dollar and higher interest-rate expectations can simultaneously pressure precious metals. Gold is not an inverse stock-market tracker.
Is a higher low enough to confirm that a downtrend has ended?+
Not on its own. An analyst may also watch for a sustained move above a prior meaningful lower high and for strength on the relevant timeframe. False breakouts remain possible.
Will Indian gold and silver ETFs fall by the same percentage as international spot metals?+
Not necessarily. ETF prices reflect underlying metal values but also currency, fund expenses, tracking differences, investor demand, market liquidity and possible premiums or discounts to NAV.
Are MCX gold and silver futures the same as holding ETFs?+
No. Futures are margin-based contracts with expiry and daily mark-to-market obligations. ETFs are exchange-listed fund units; they also have market risk, but ordinary unleveraged ETF ownership is not equivalent to a leveraged futures position.
Can I use HH/HL/LH/LL patterns to predict the exact bottom in gold or silver?+
No. Market-structure labels describe historical swing relationships and can help frame scenarios, but they do not identify a certain bottom, guarantee a reversal or replace risk assessment.
Disclaimer
Educational market information only, not a personalised investment recommendation or a prediction of gold or silver prices. Figures are dated 20 November 2026 and may change. ETFs can decline in value; commodity derivatives involve margin and substantial risk. InvestEdge360 is operated by Vijayvargiya Financial Services, an Authorized Business Partner of Motilal Oswal Financial Services Ltd. This is not the official Motilal Oswal website. InvestEdge360 does not claim independent investment-adviser registration or guaranteed performance. Verify product terms and suitability before investing.
Research Team
InvestEdge360 Research
Content Research Desk
Insights from InvestEdge360's research desk — written to help investors learn with clarity and invest with discipline.
Exploring Gold and Silver ETFs During Market Volatility?
Understand ETF structures, market-price and NAV differences, costs and risk before considering gold or silver exposure. Explore investment information through InvestEdge360.
Explore Gold & Silver ETFsRelated Articles

Was this article helpful?